Statistics
Access your website traffic statistics through the TOPlist interface.
Login to Statistics
Statistics allow you to log in using either your TOPlist ID and password (the same credentials used for editing records) or via email. This requires registration with the TOPlist Profi service (free of charge) and assigning measured websites to your account.
Menu
In the top right corner of the screen, there is a basic menu for changing the displayed period:

The following buttons are available:
- < - move to history
- > - move to the future
- >| - move to today's date
In the top right corner of the screen, there is also a button to switch between two or three columns.
In the menu, after hovering, more options are revealed. In the left part, there are quick links to specific statistics. On the right, you can choose statistics for longer periods (week, month, year). You can also select which website is being displayed. Finally, there is an option to log out. The step (minimum time interval) changes depending on the selected period according to the following table: | whole period | step | |---|---| | day | hour | | week | day | | month | day | | year | week |
Information
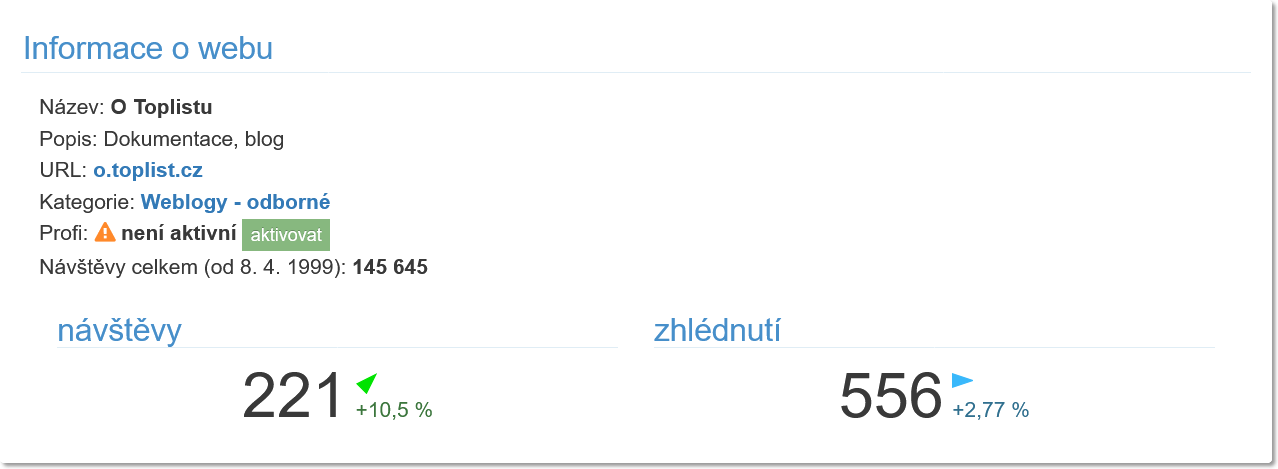
Total traffic history
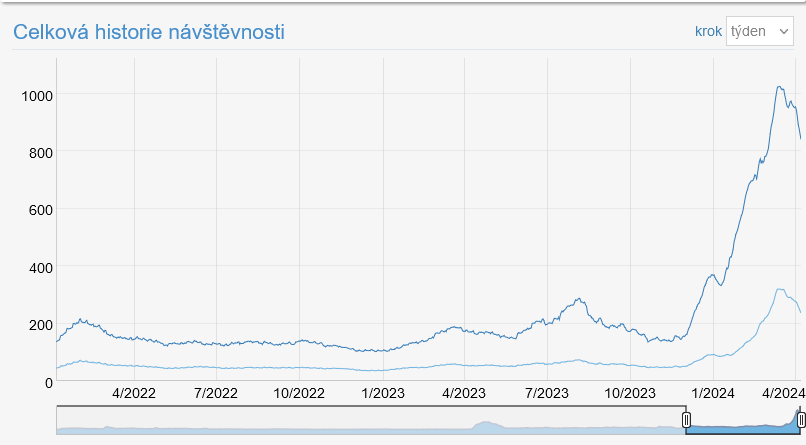
The first statistic is an overview of total visits (number of visits and pageviews) since registration. By default, a floating weekly average is shown, which is not affected by the difference in traffic during weekdays and weekends. In the "step" menu, you can change it to the number for 1 day, week, or 30 days.
Record
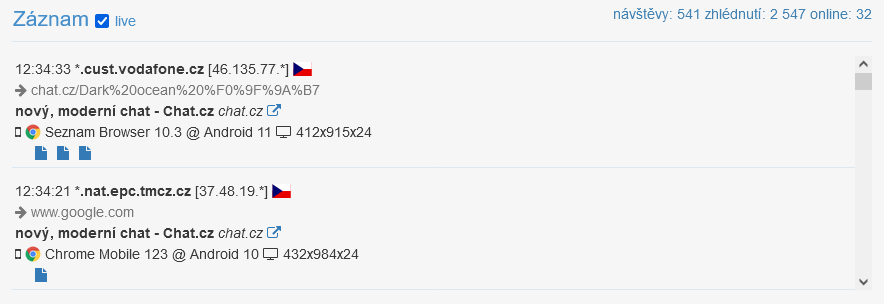
The following list shows the most recent recorded visits. In the top right corner, you can see the updated count of today's visits, pageviews, and the current number of online visitors.
In the Profi version, it is possible to activate the "live" option, which enables automatic updates of the display, including an overview of additional pageviews within a single visit.
The following information is displayed: - time of visit, anonymized hostname and IP address, flag icon with country (two-letter code in description) - referrer of the visit - page title, its URL, and link to the page - device icon (mobile, computer, etc.), browser icon, browser version and OS, resolution in width x height x color depth - icons for additional pageviews with a link to the page (time, page title in description)
Statistics
Statistics allow two or three types of display. This is switched using icons in the top right corner of the block:

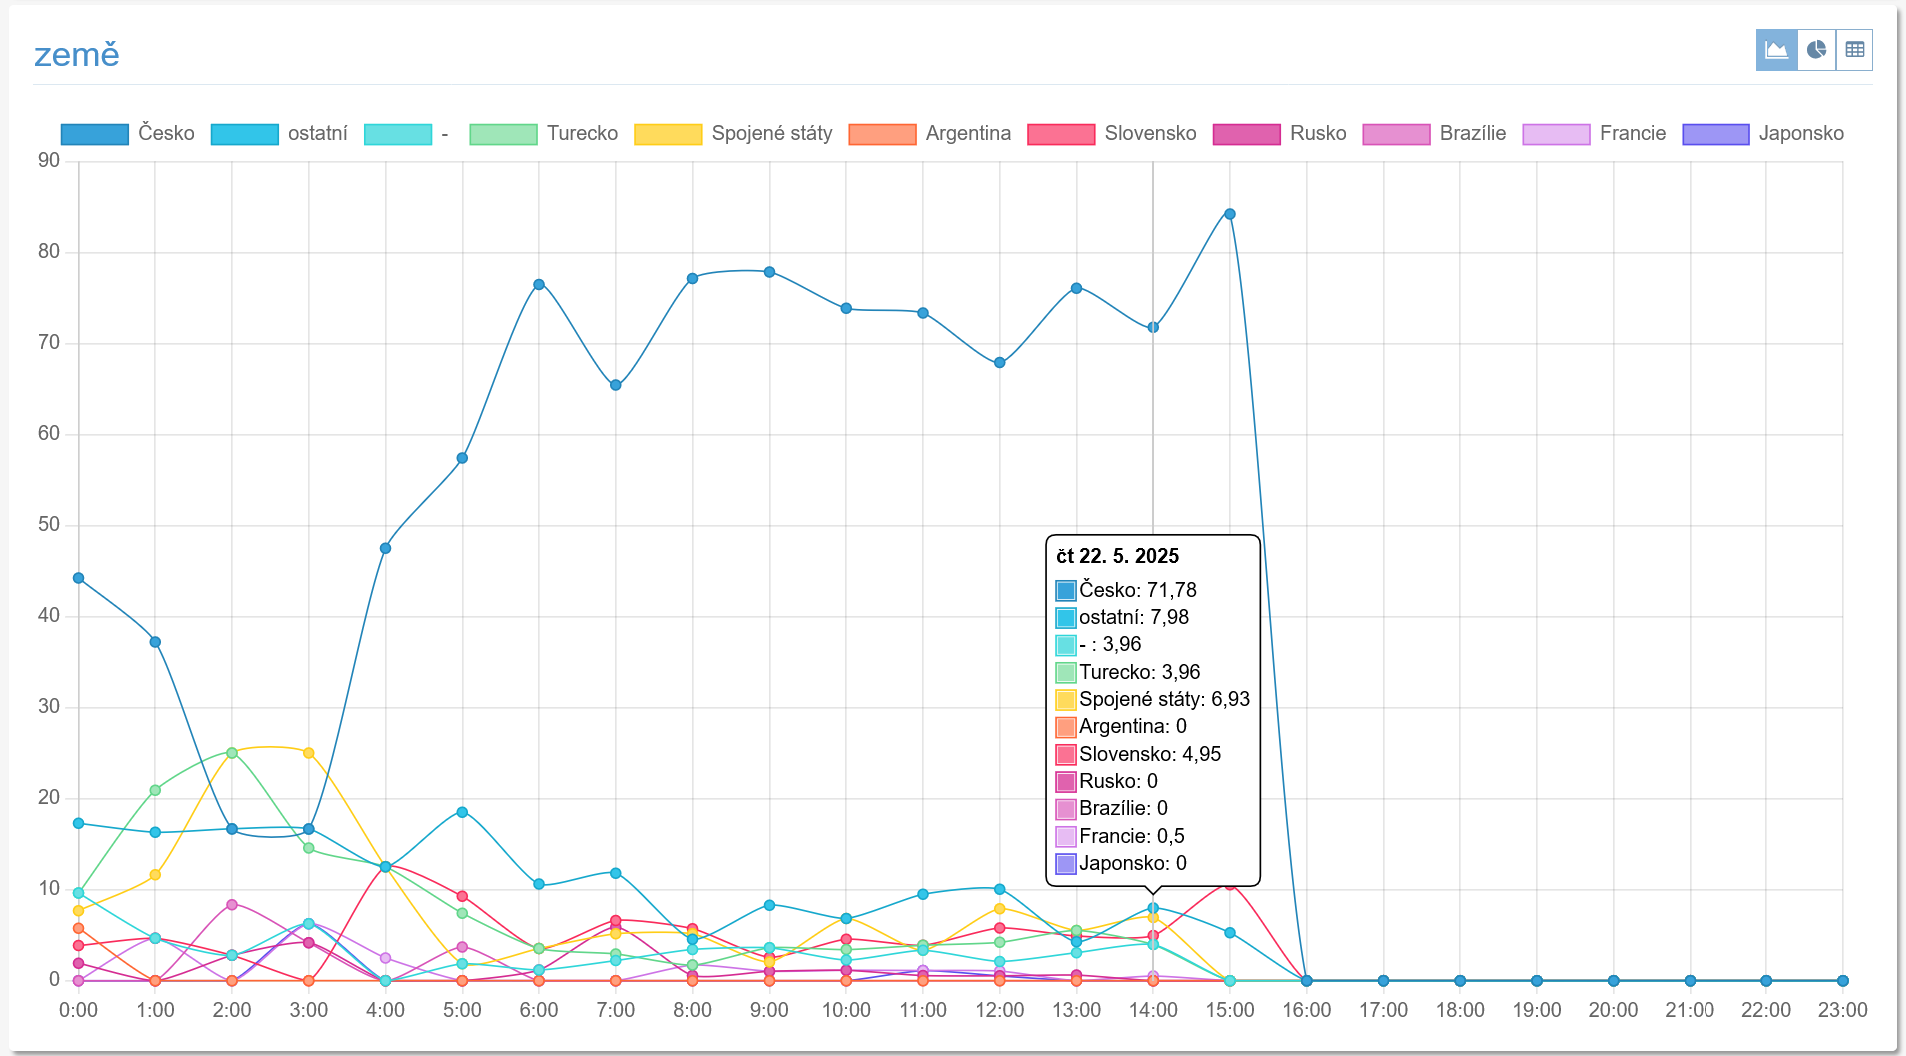
For example, for countries of origin, you can switch between:
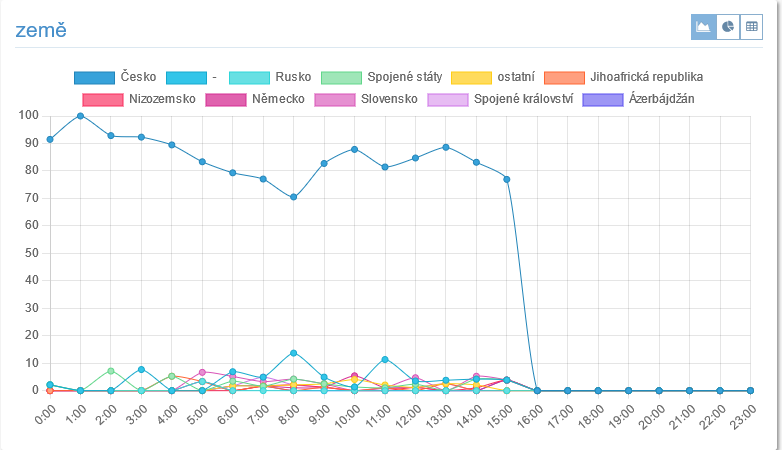
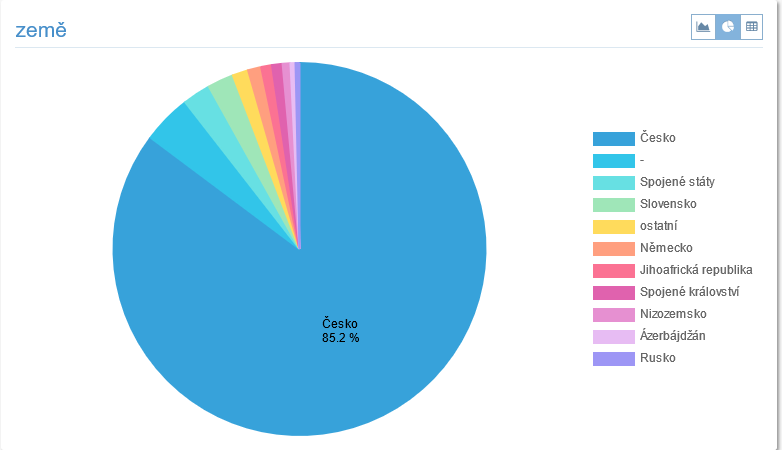
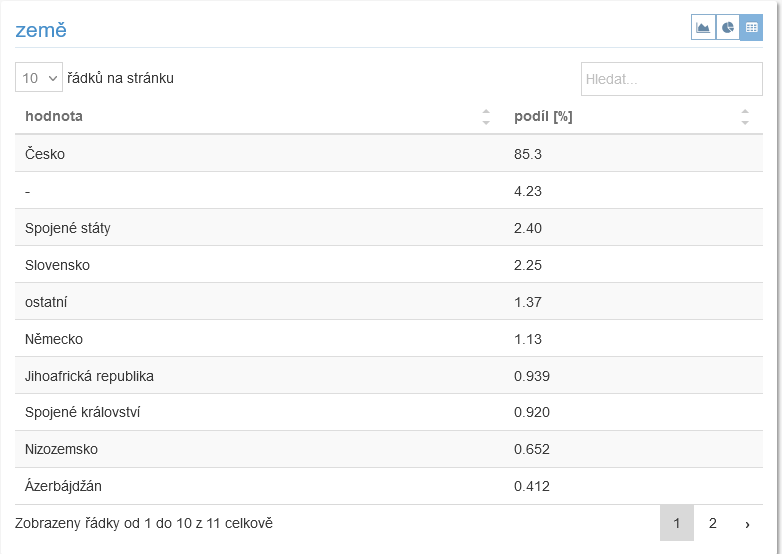
When a graph displays one type of value, it also shows the sum, average, maximum, and minimum for the displayed period. The maximum and minimum in parentheses show when they occurred.
Traffic
Section displaying basic statistics related to user access to your pages.
Visits
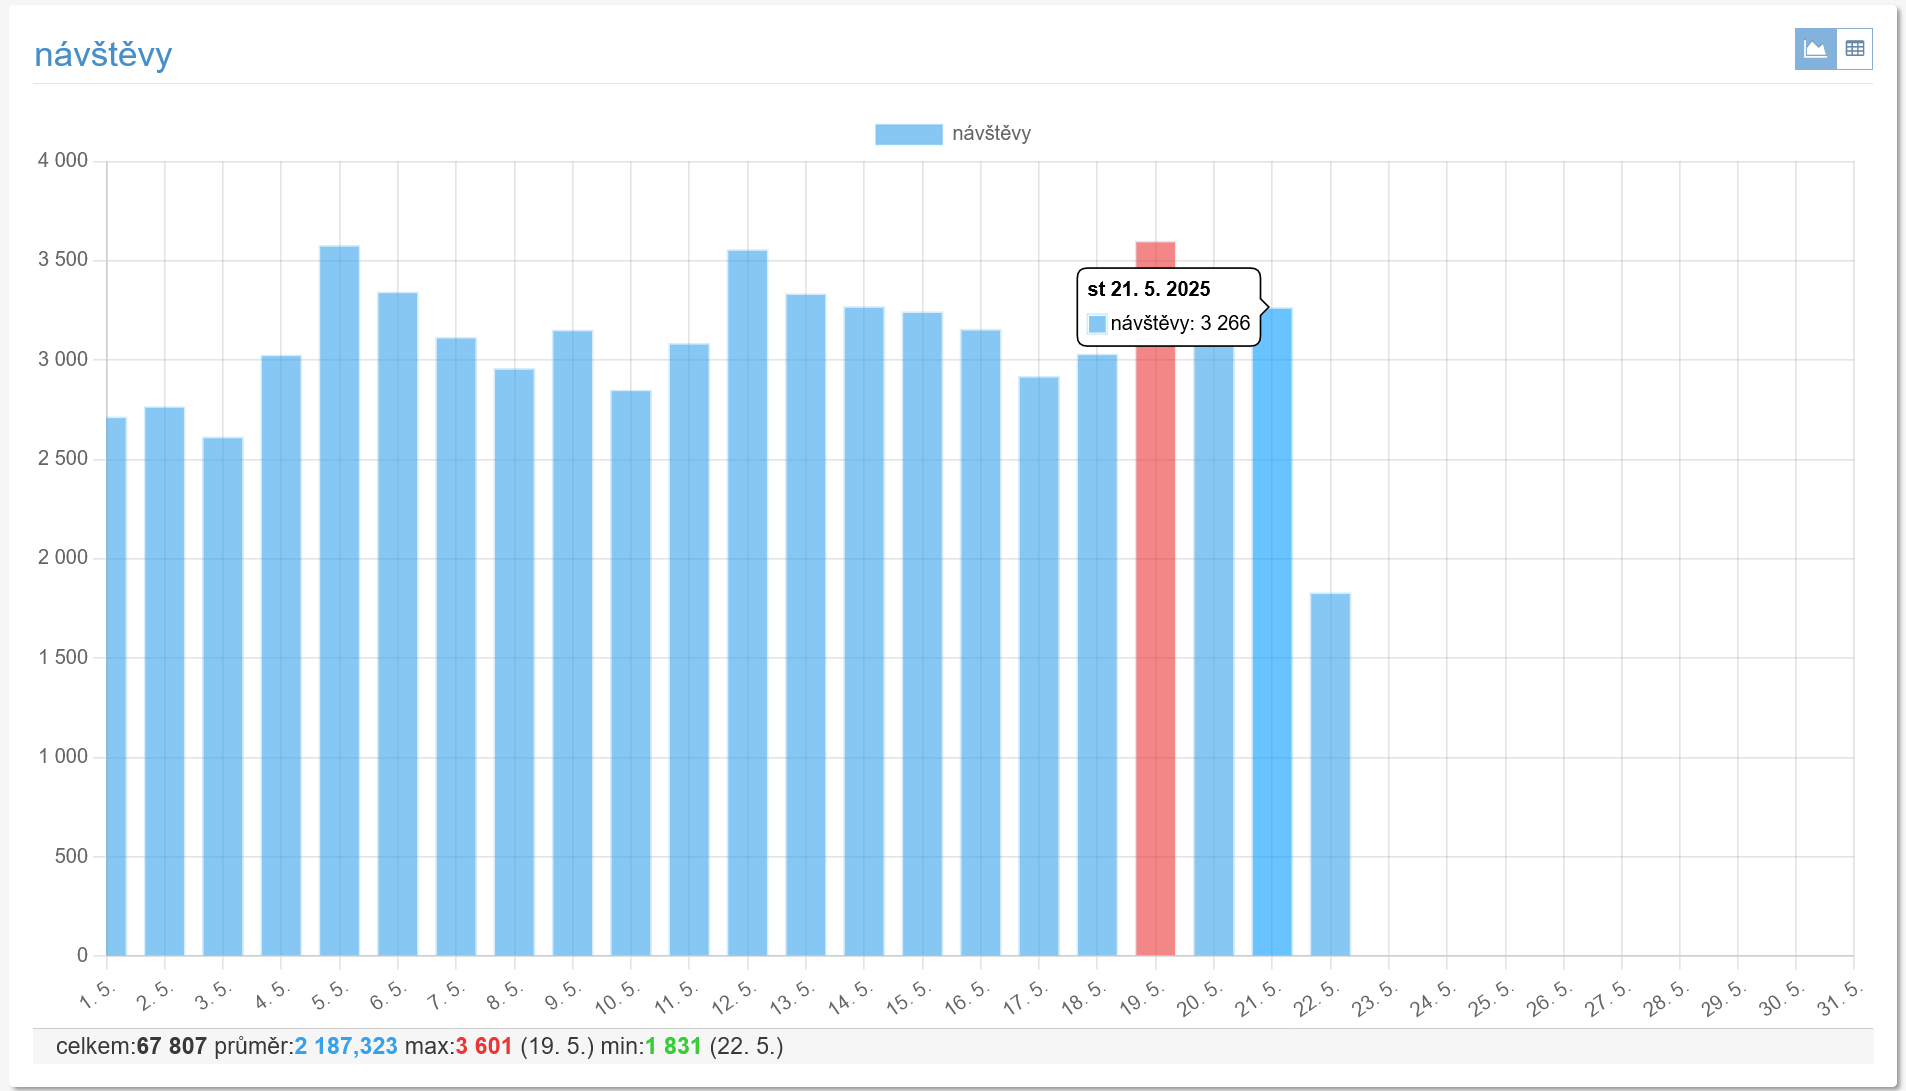 Graph of visits in the measured period.
Pageviews
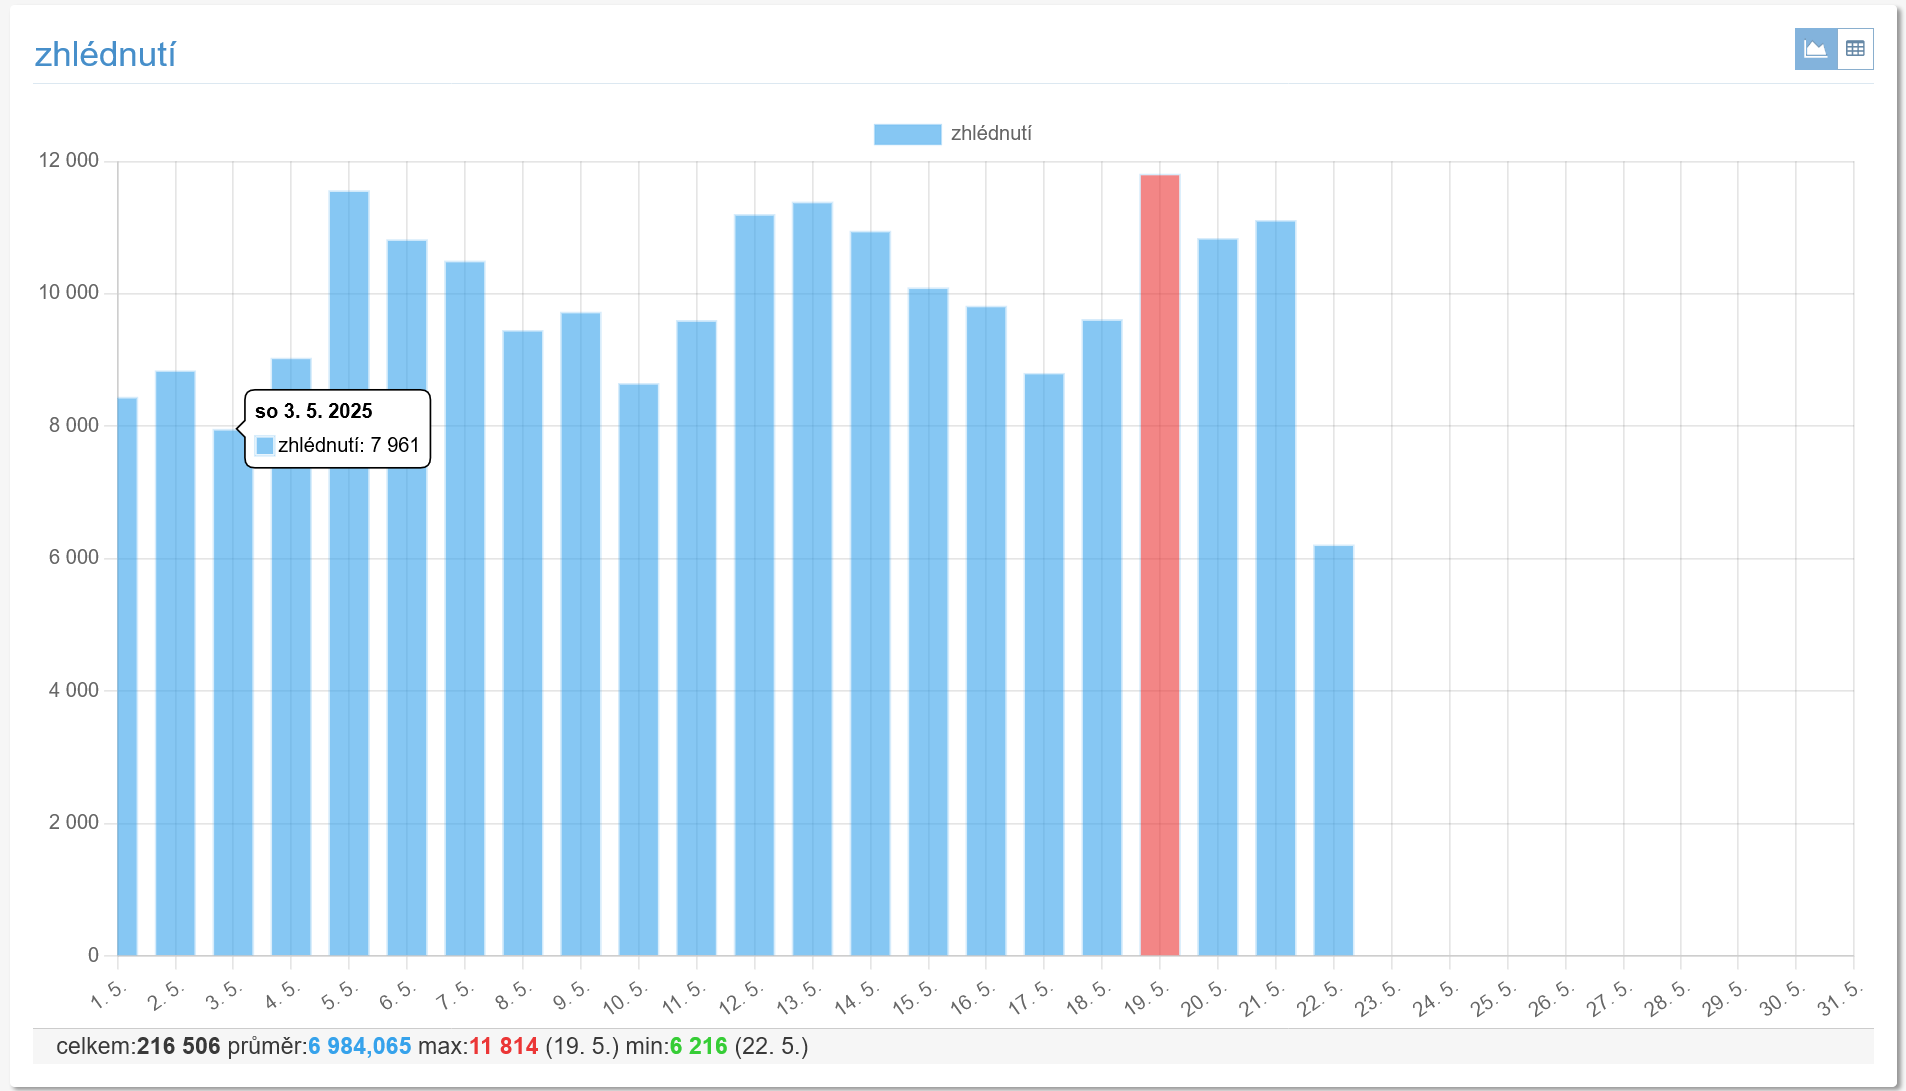 Trend of the number of pageviews in the period.
Countries
Hourly traffic
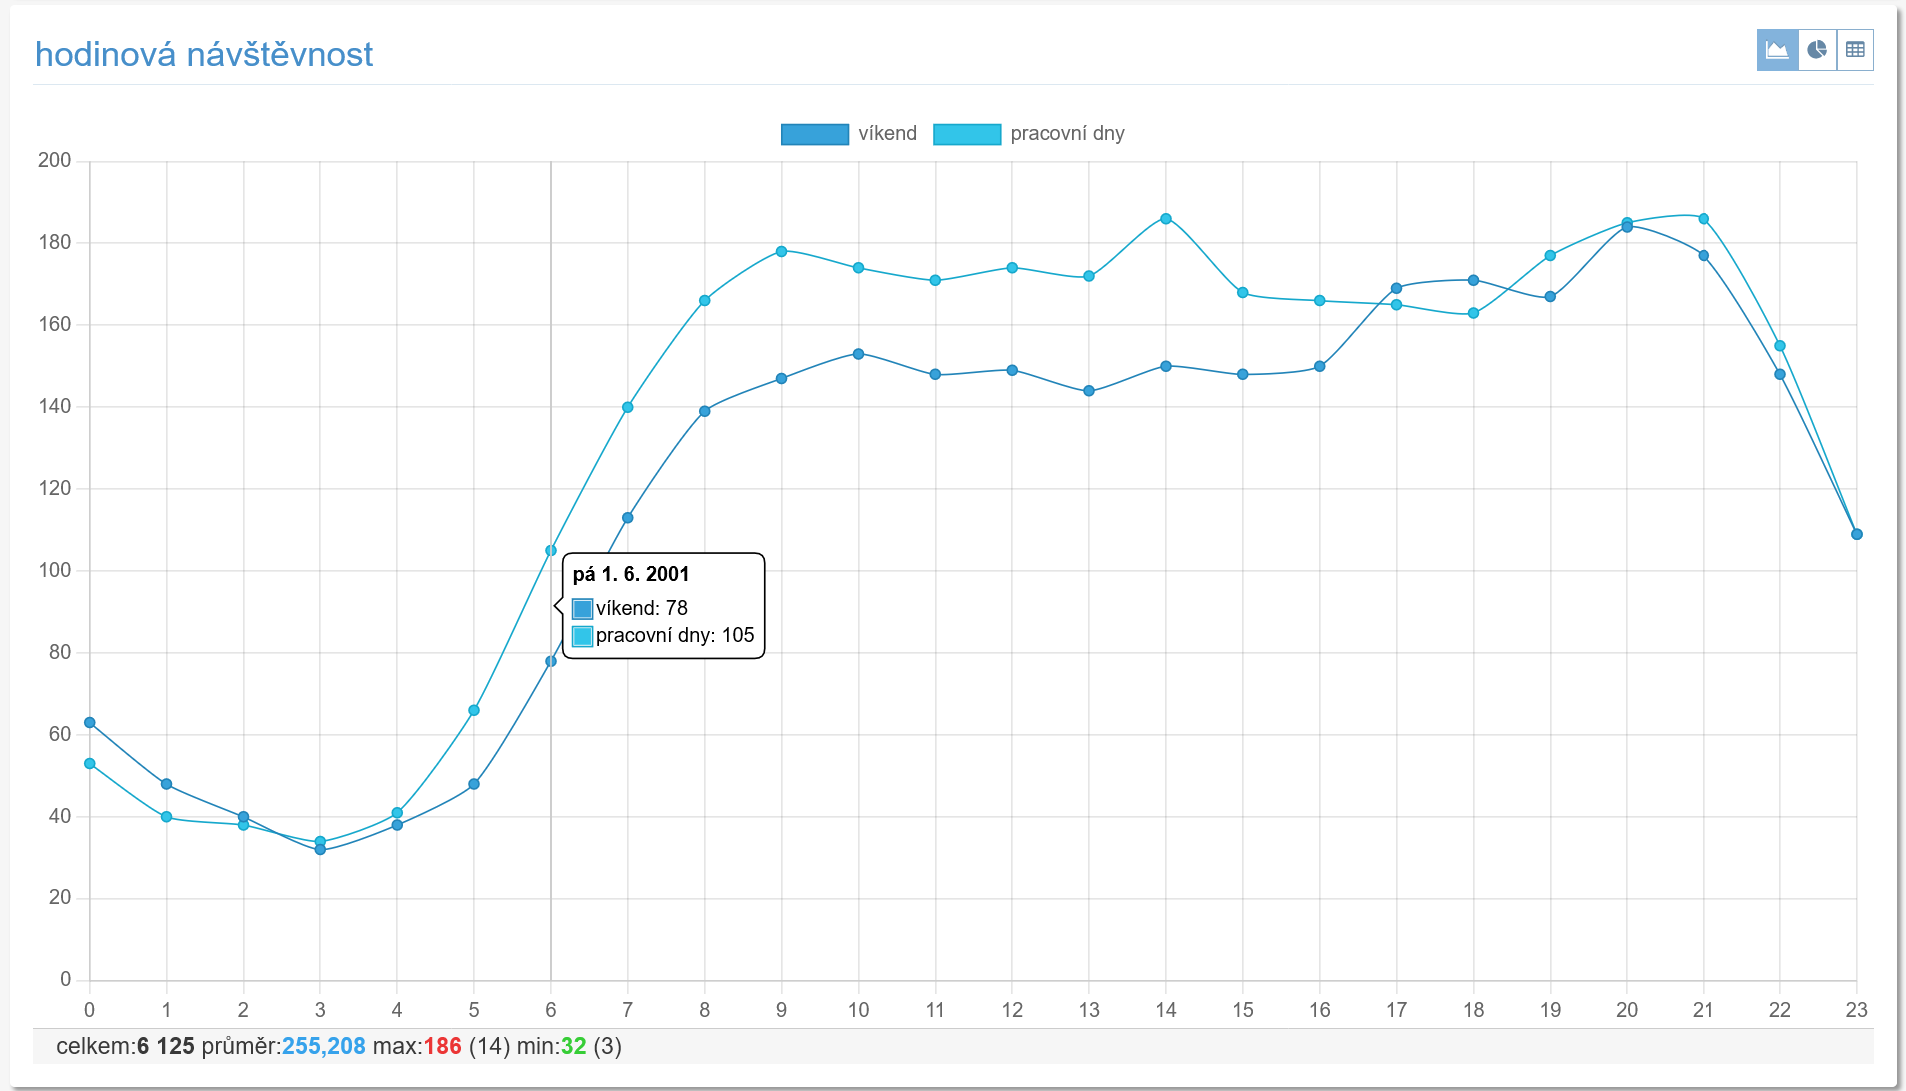 Average traffic by hour over the whole measured period.
Traffic by day of the week
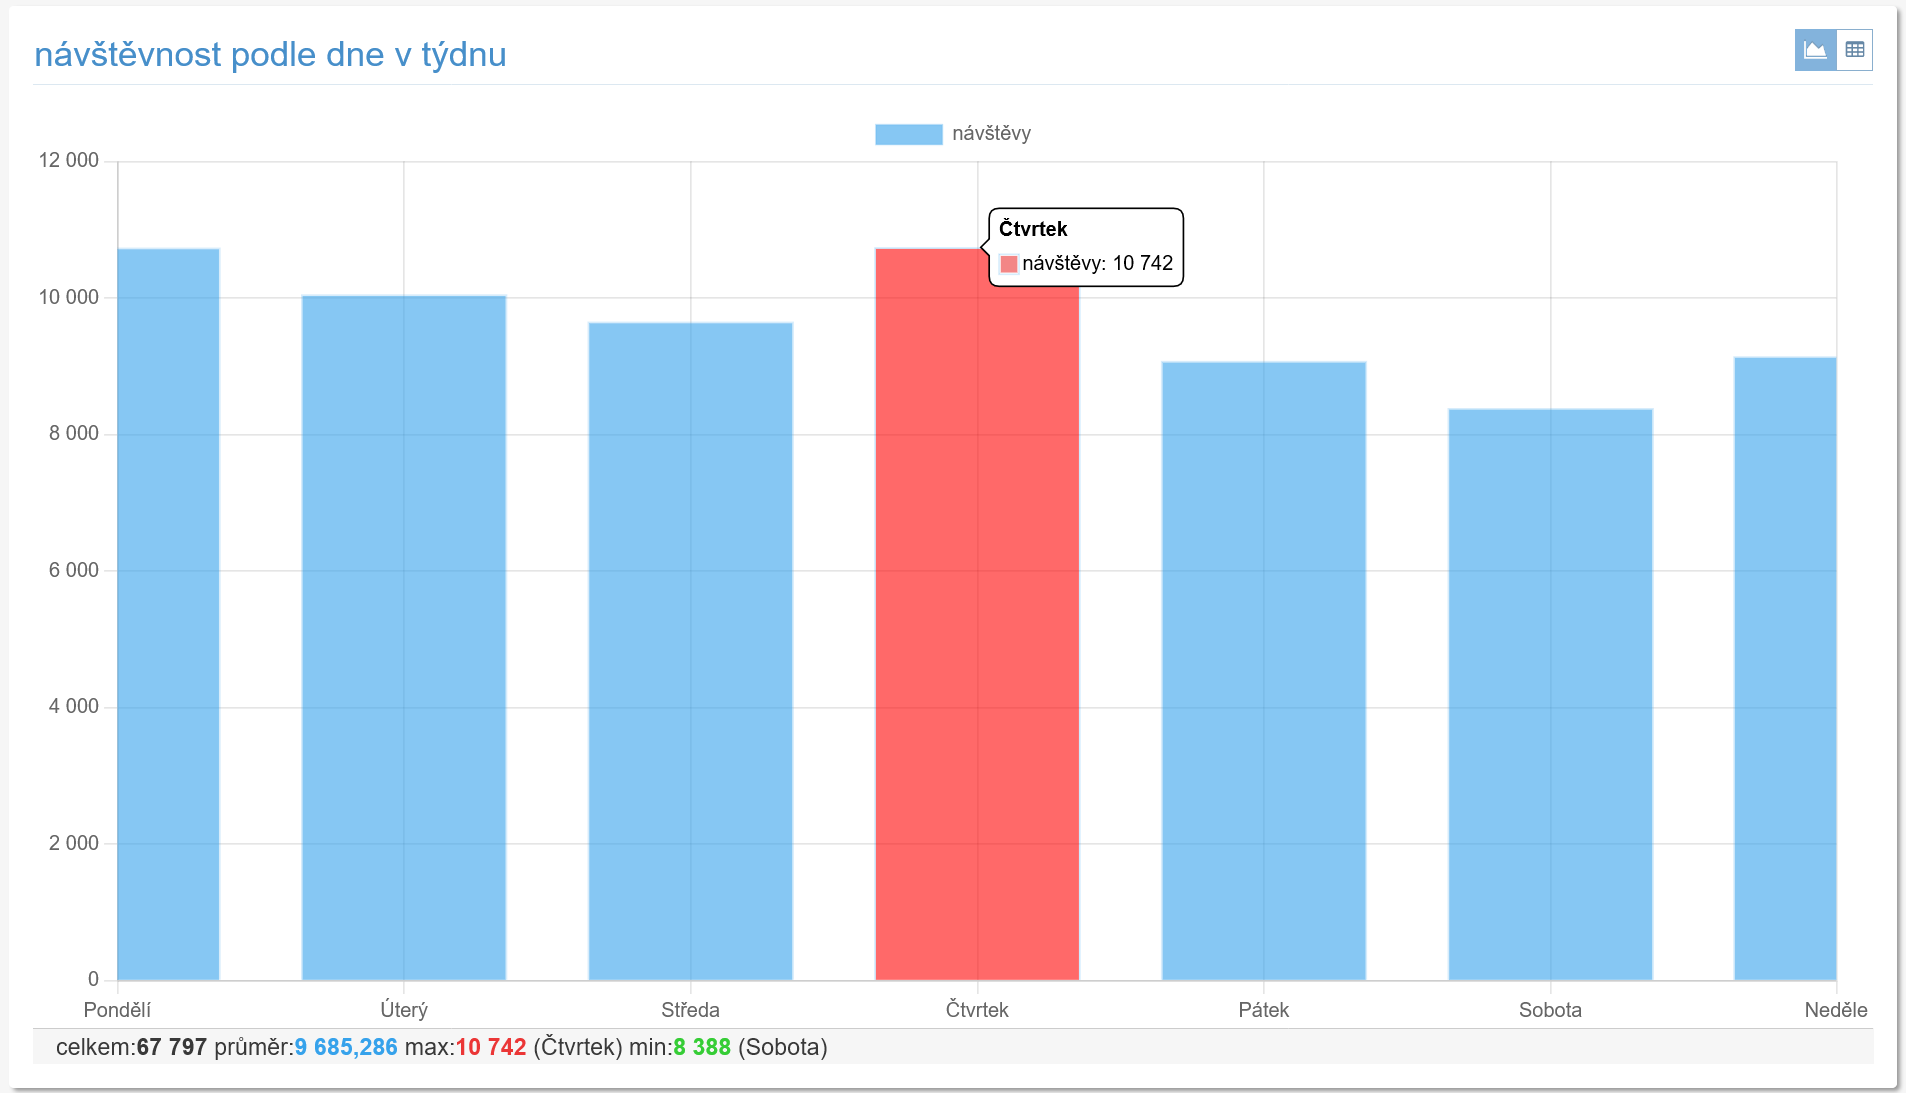 Average traffic by day of the week over the whole measured period.
Visits - domains
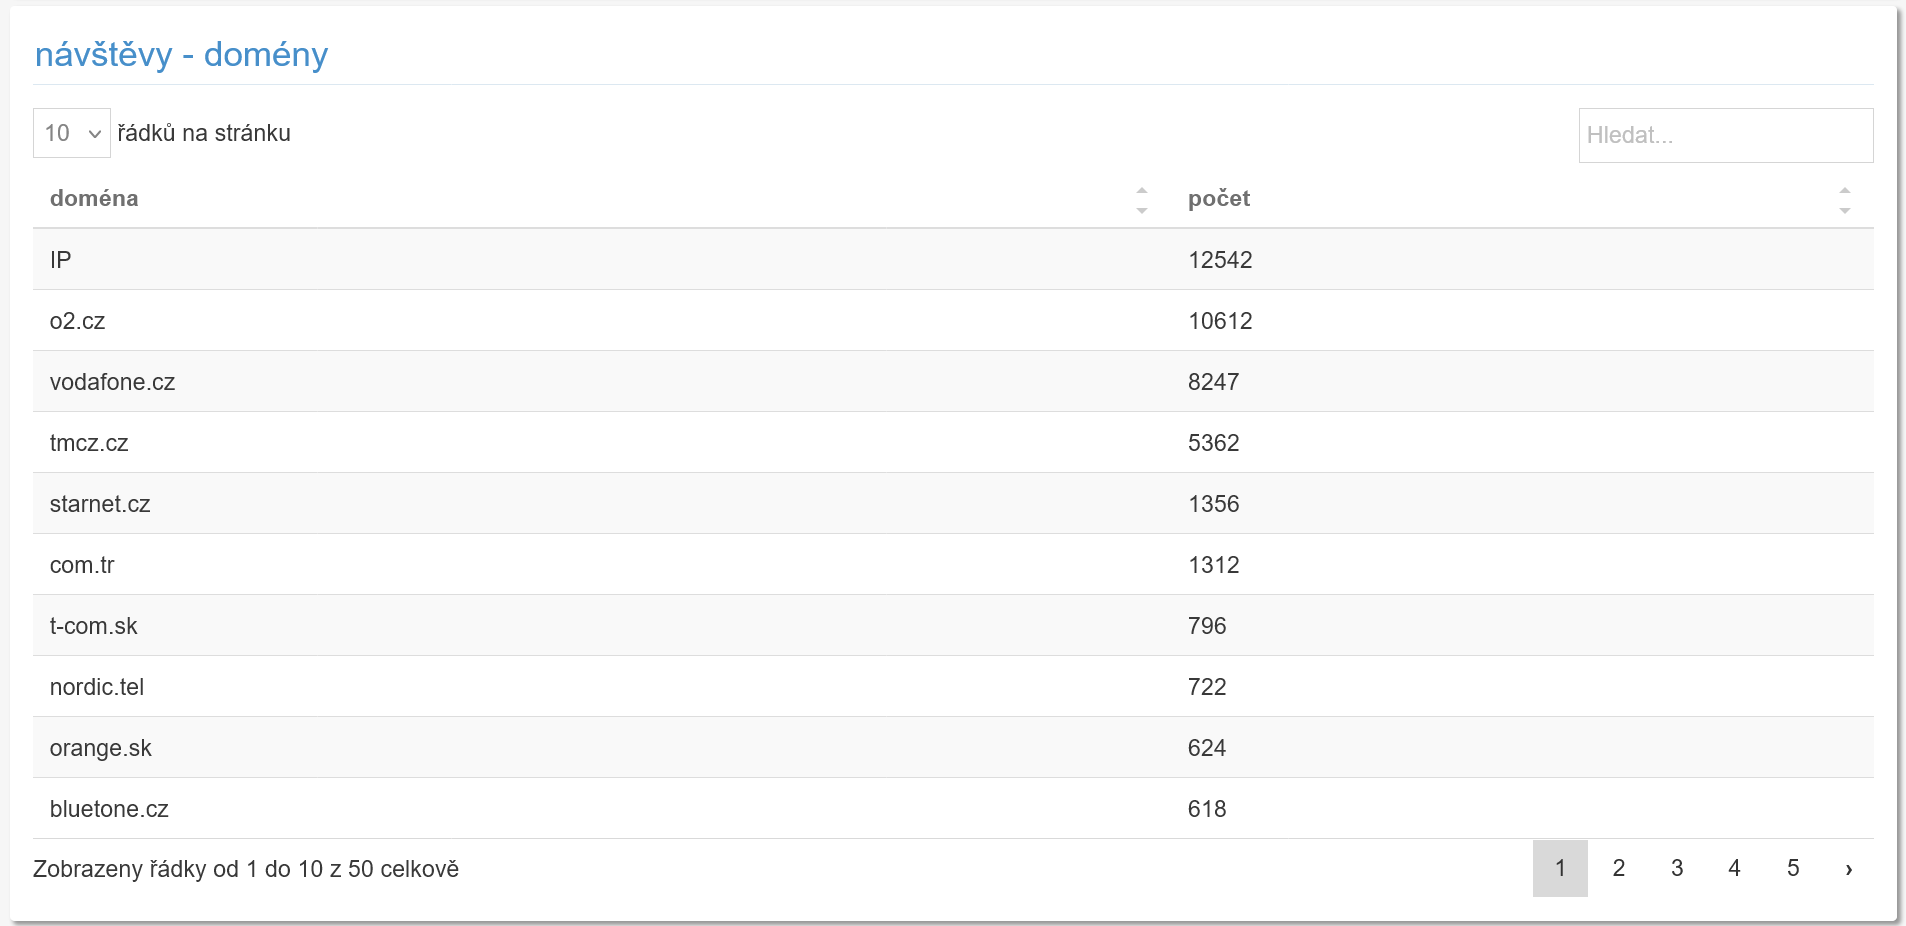
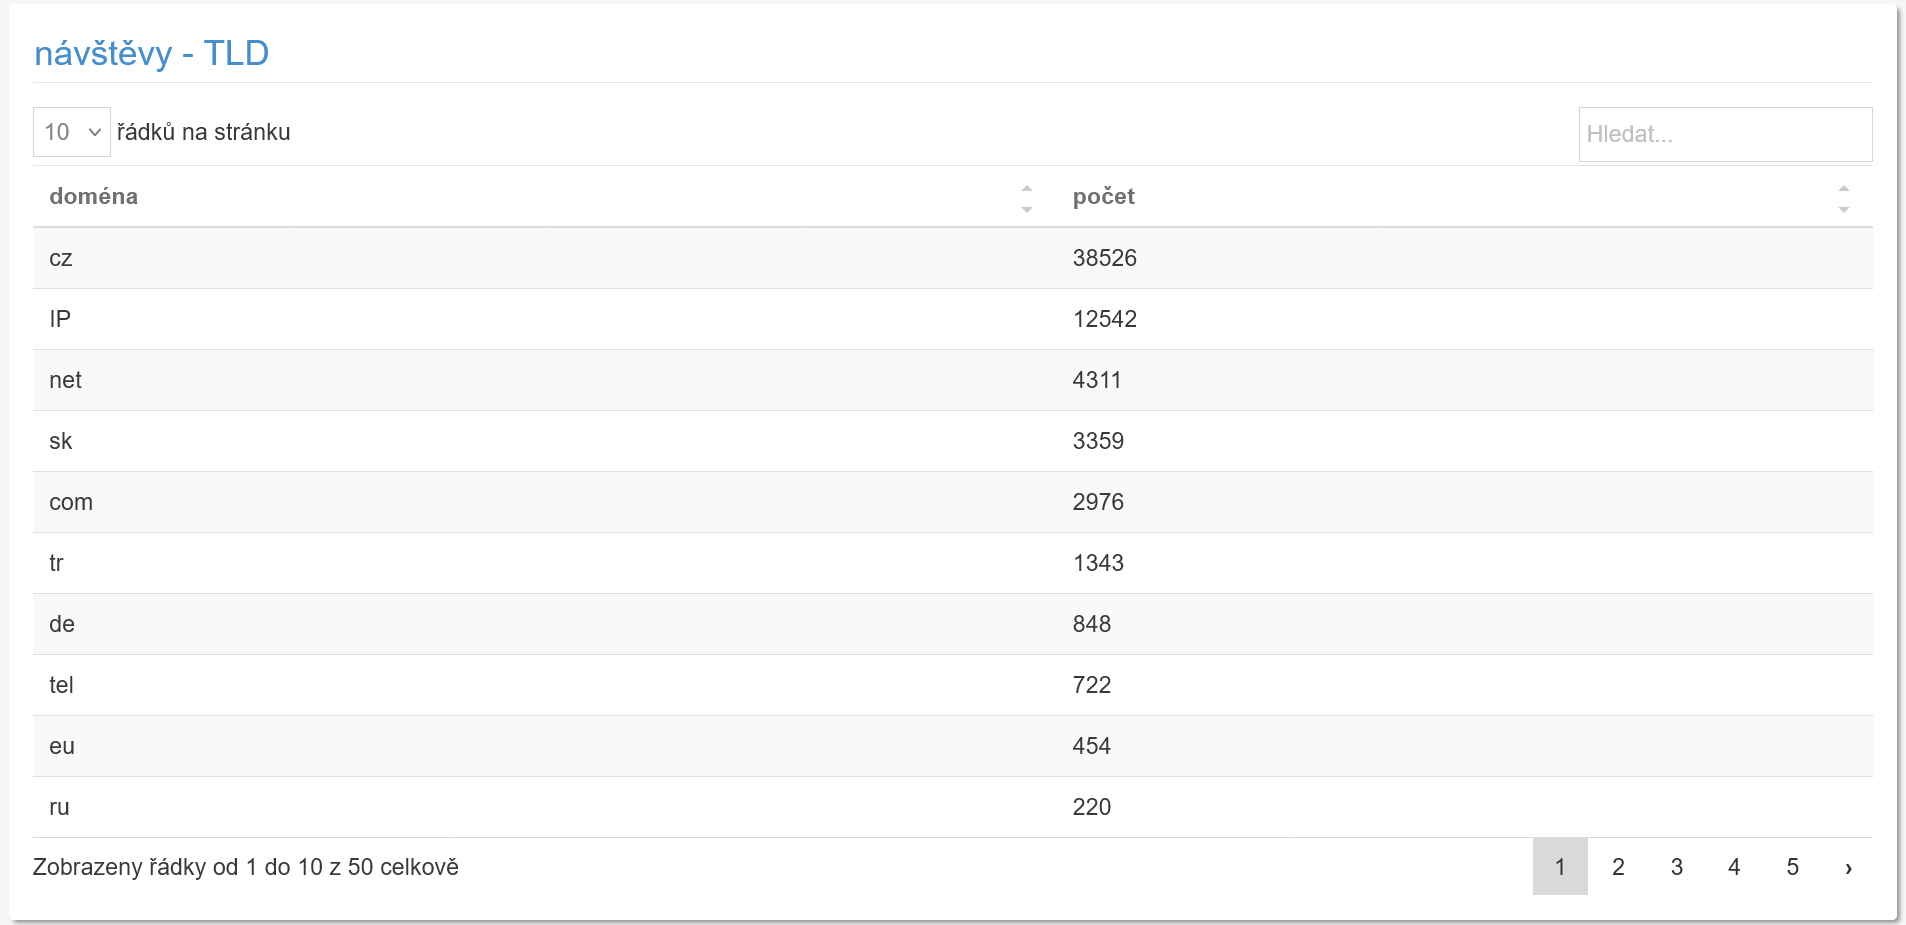
Visits - TLD
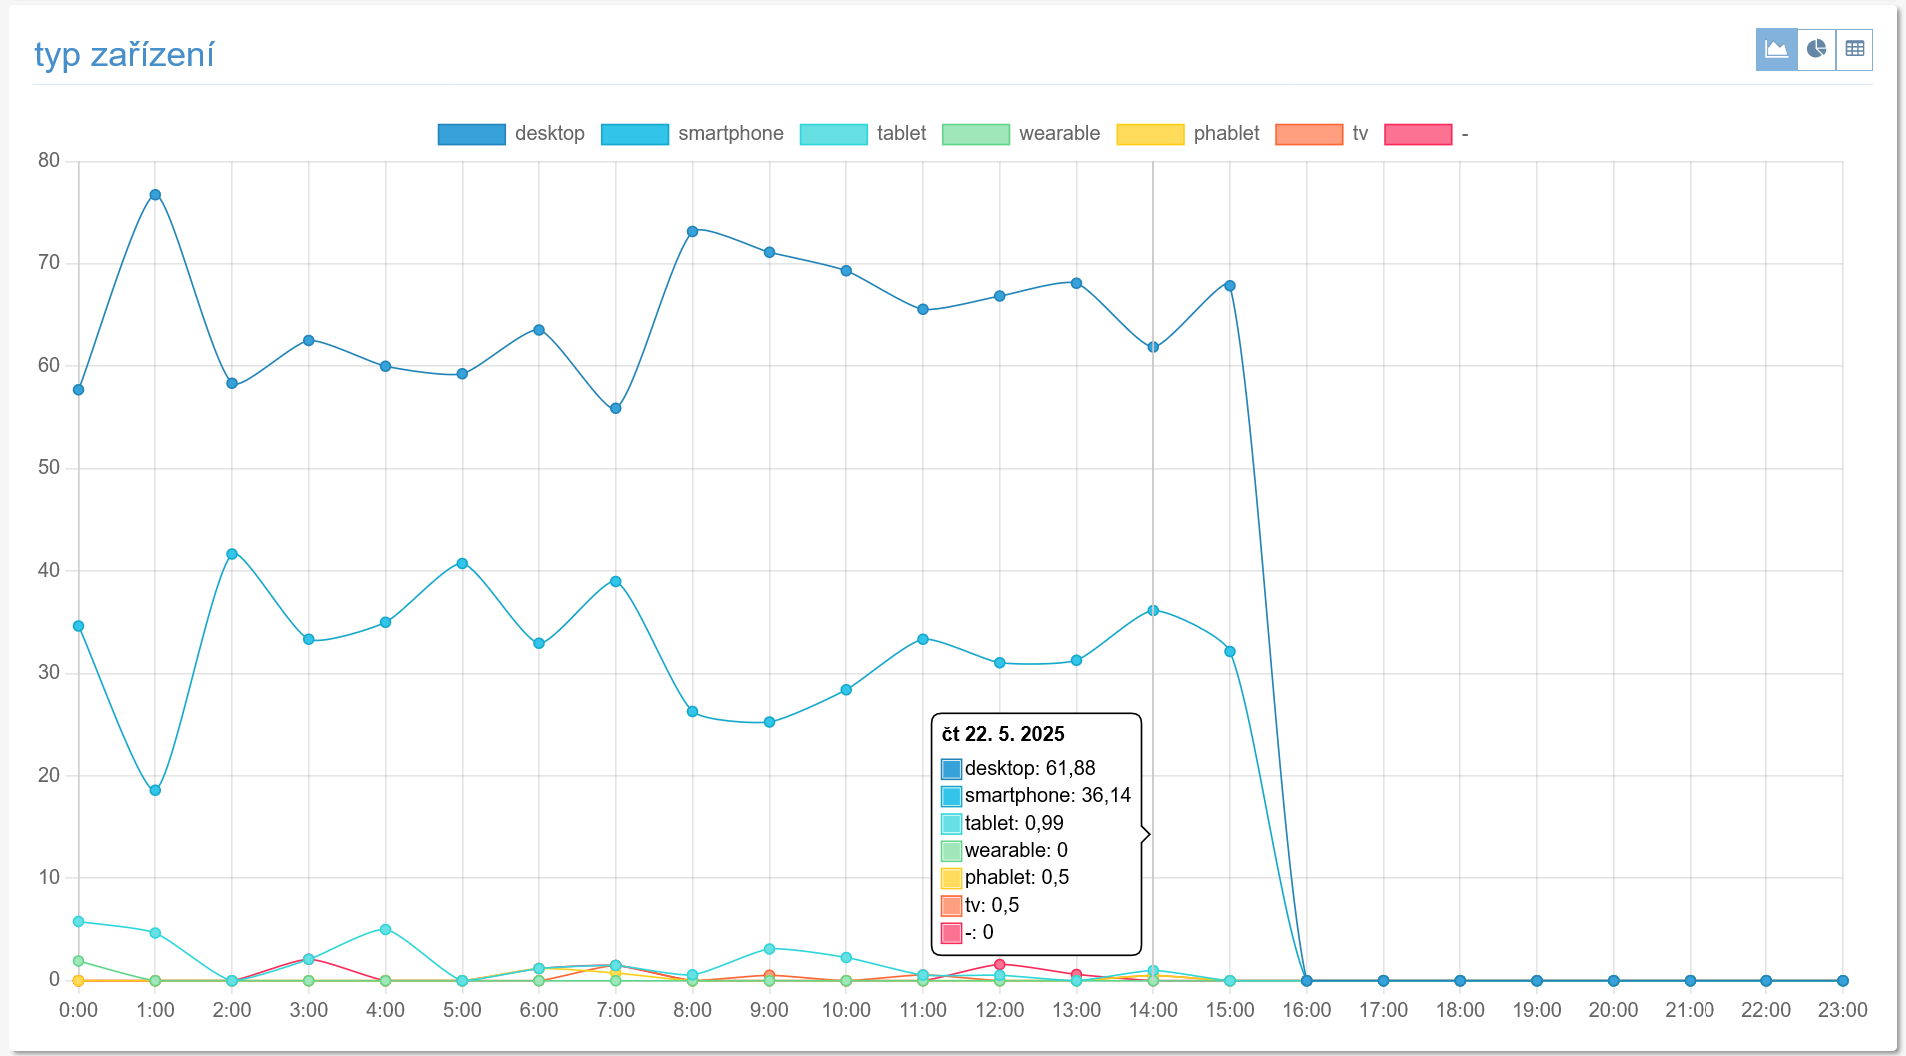
Devices
The second section shows statistics related to the devices used.
Browsers
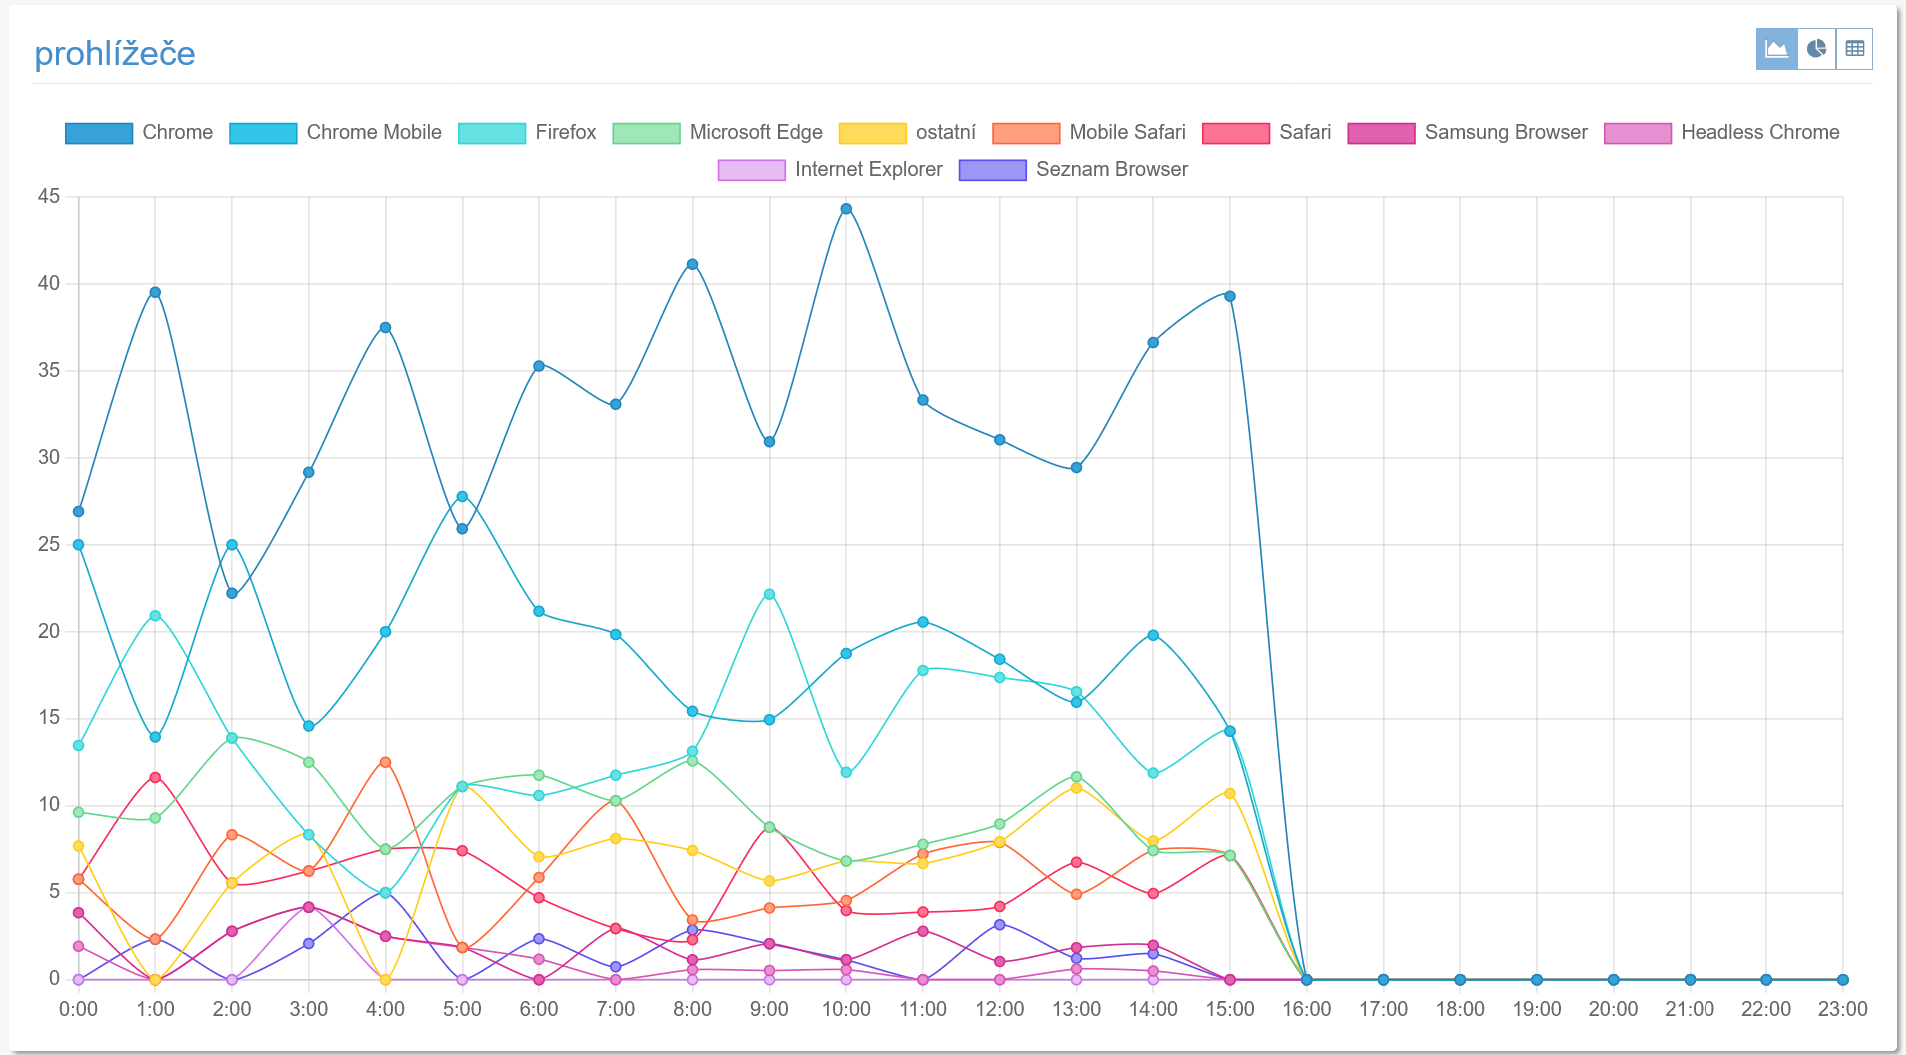 Time development of the share of individual browsers.
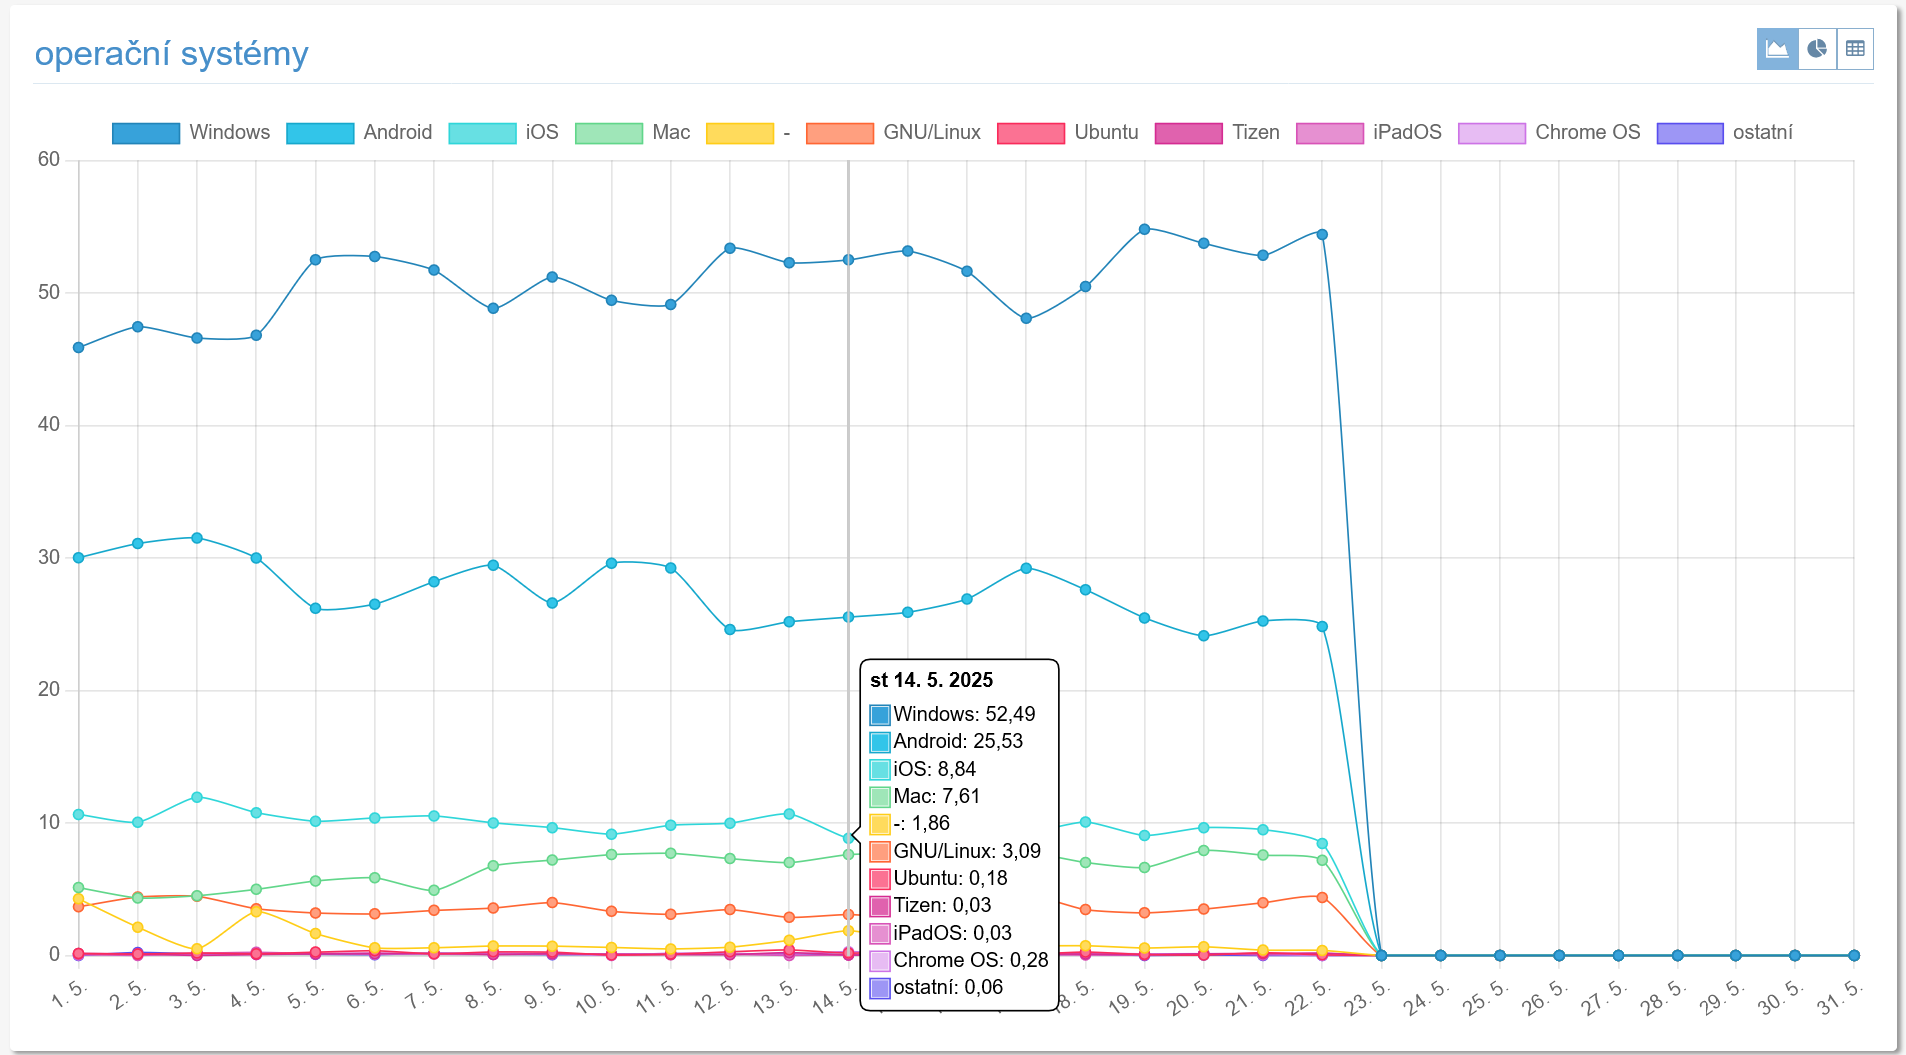
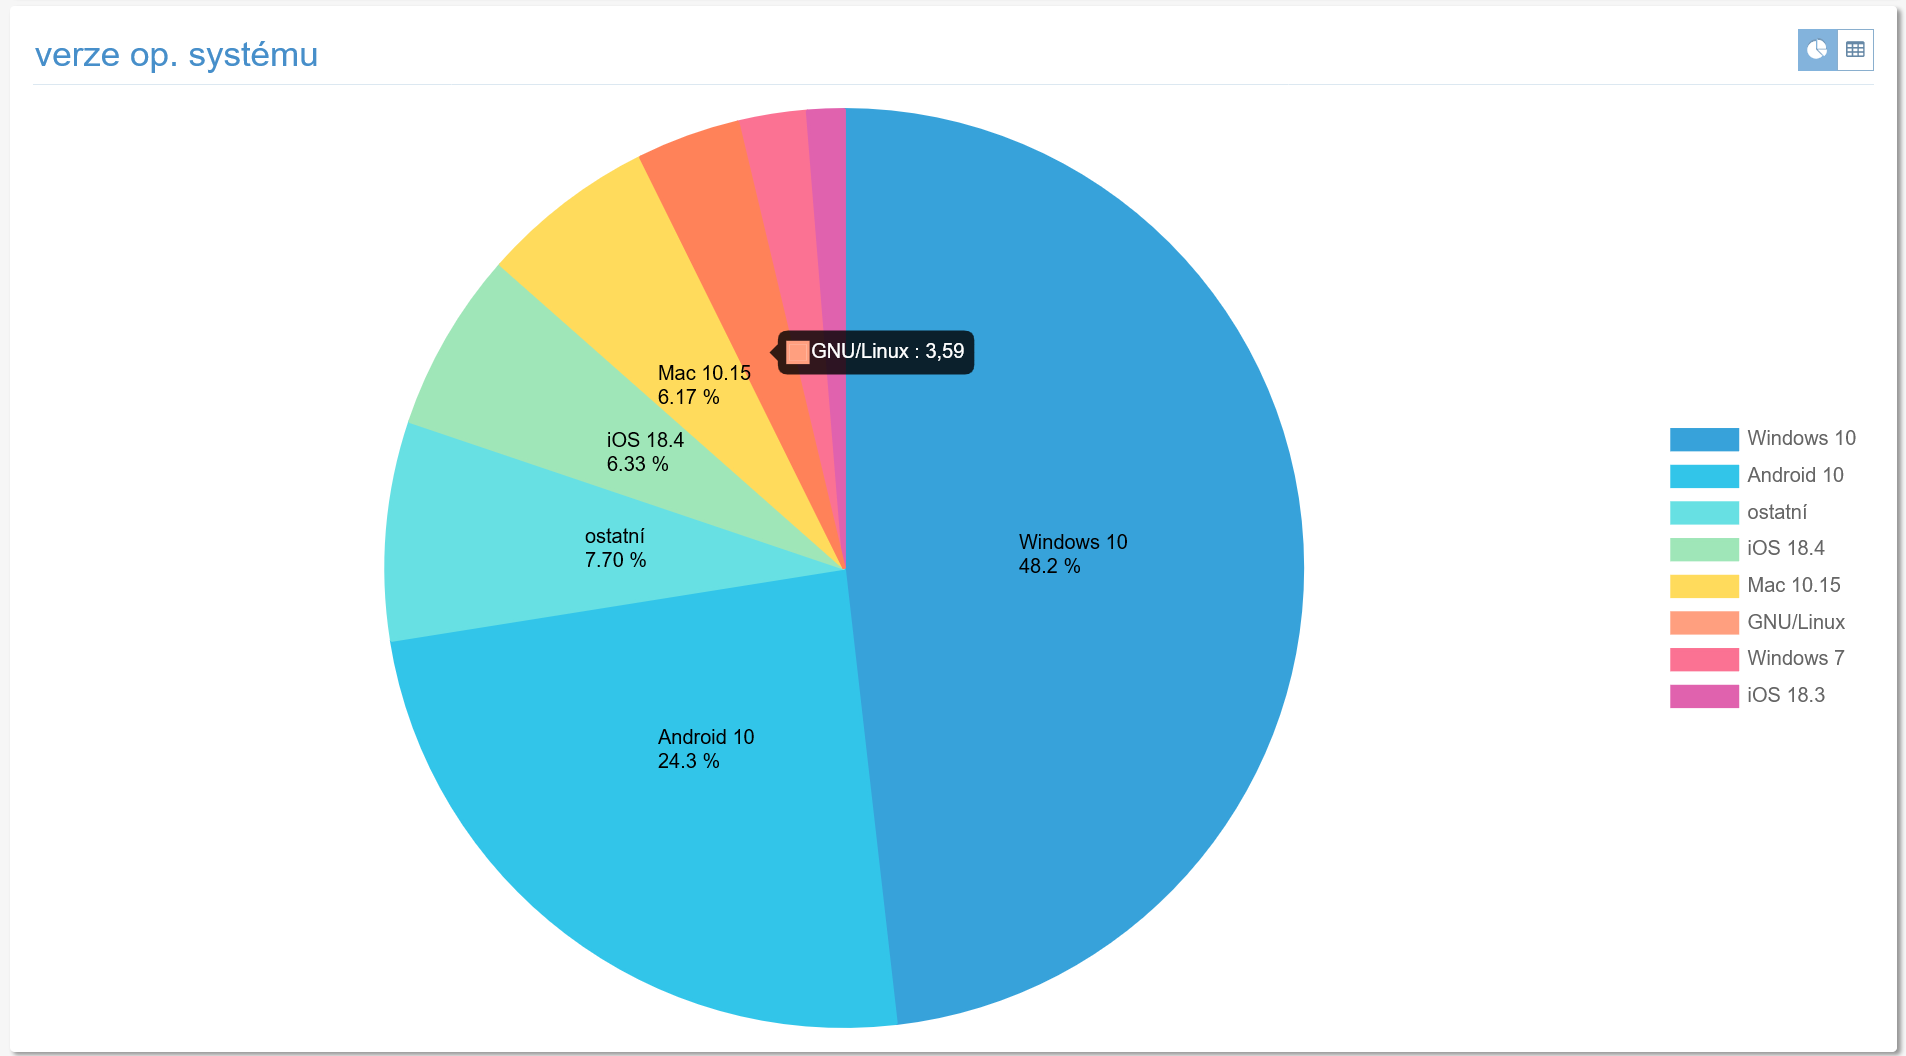
Operating systems
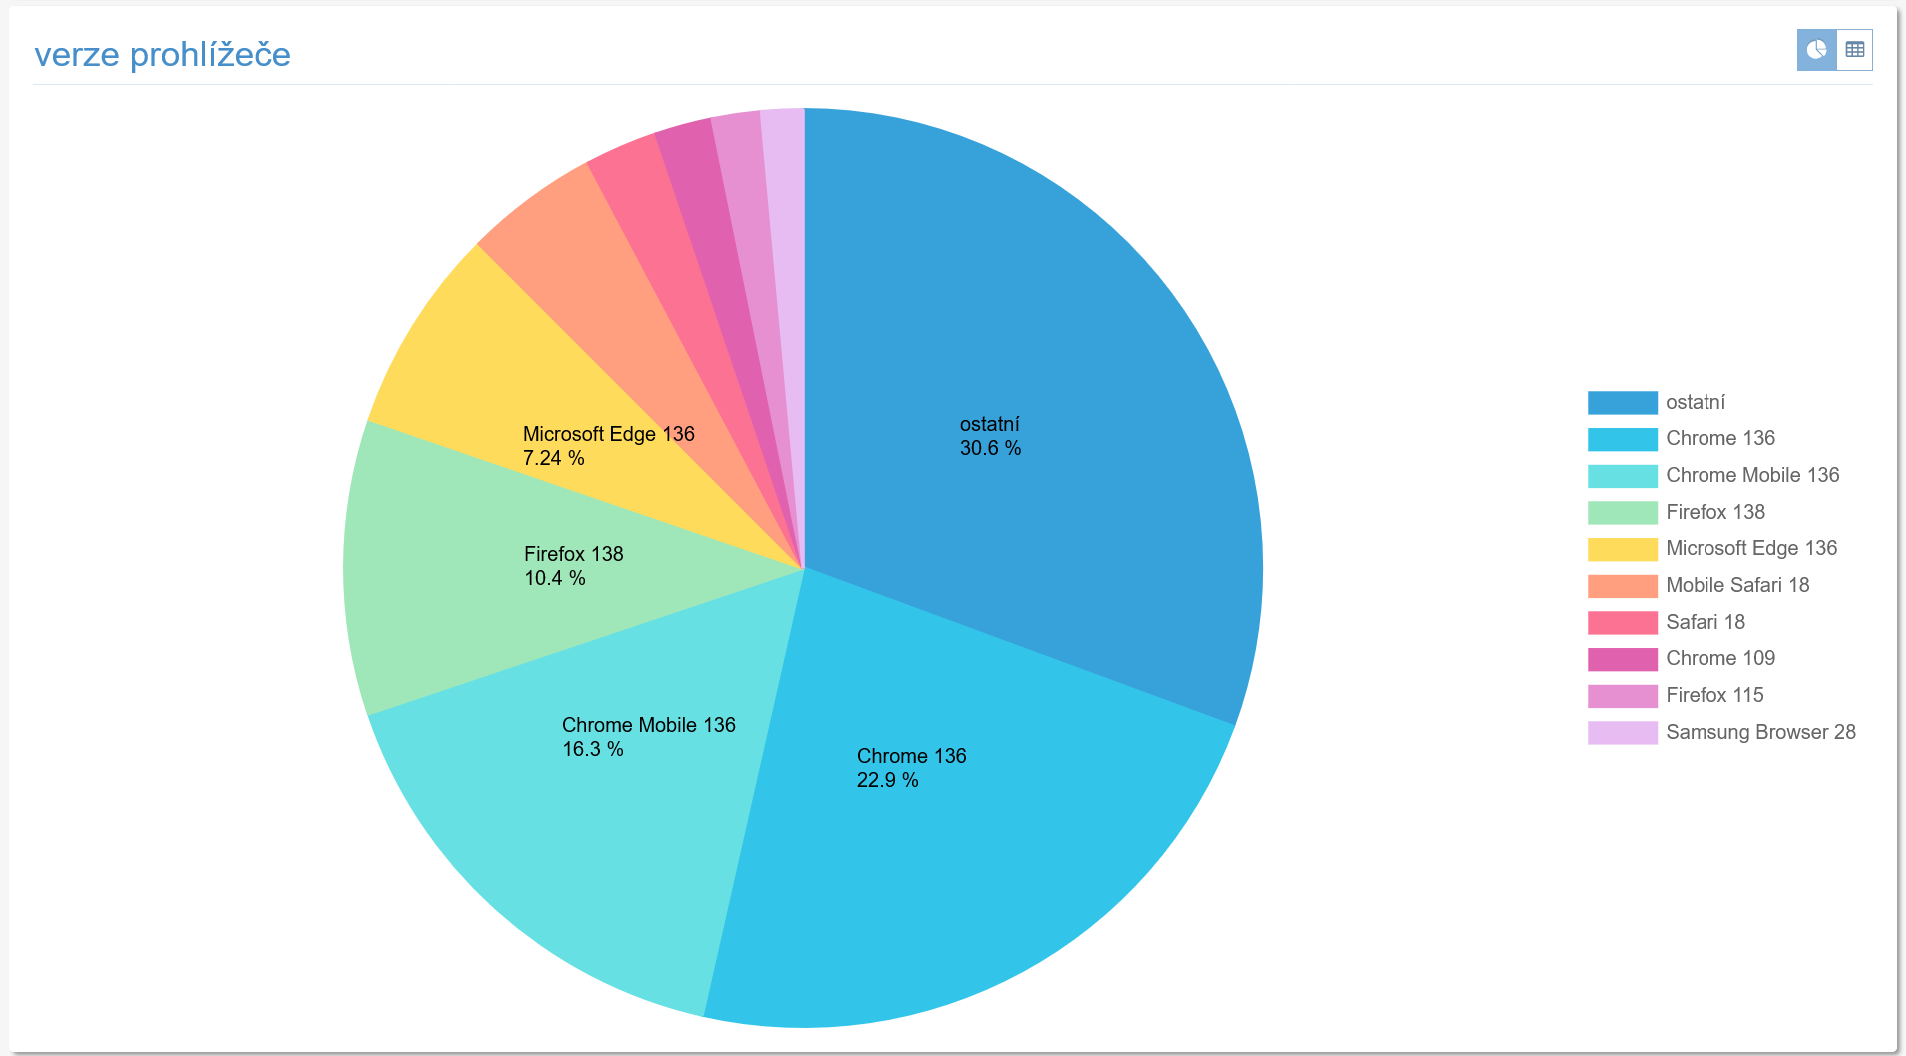
Browser version
OS version
Device type
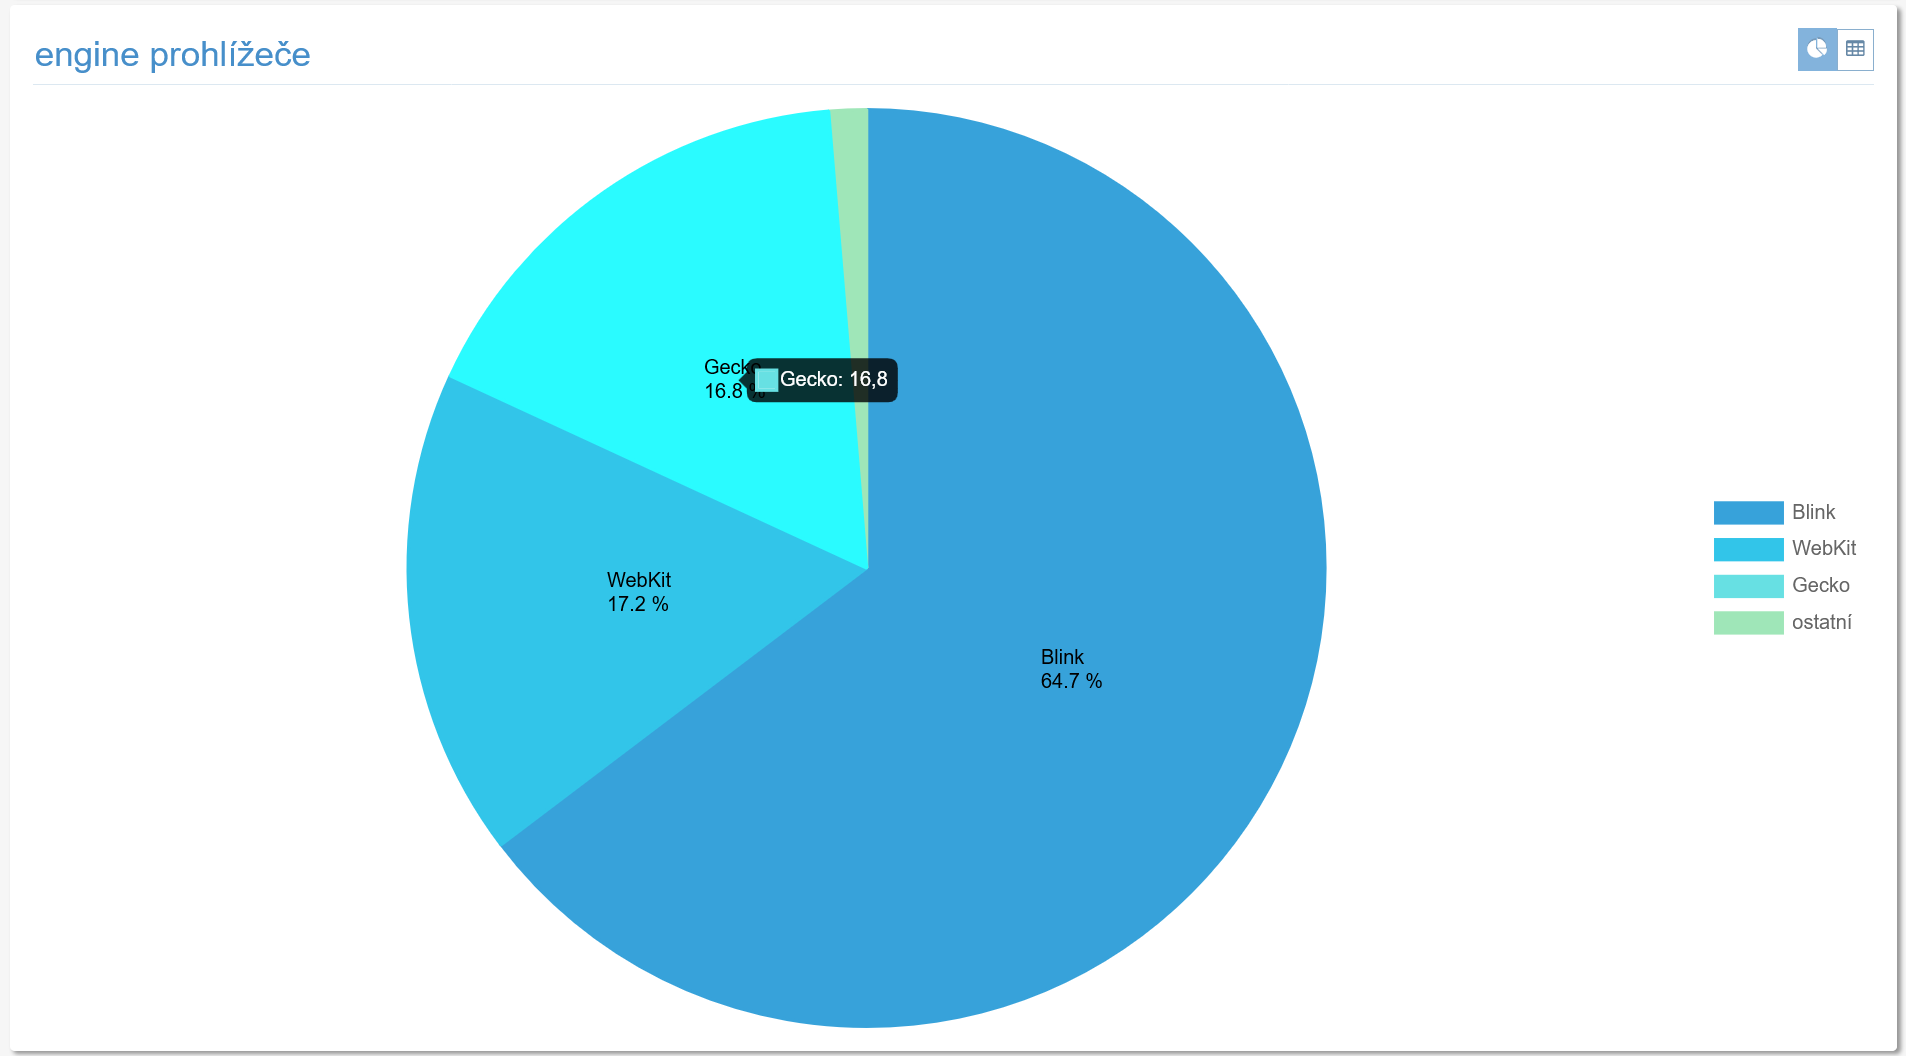
Browser engine
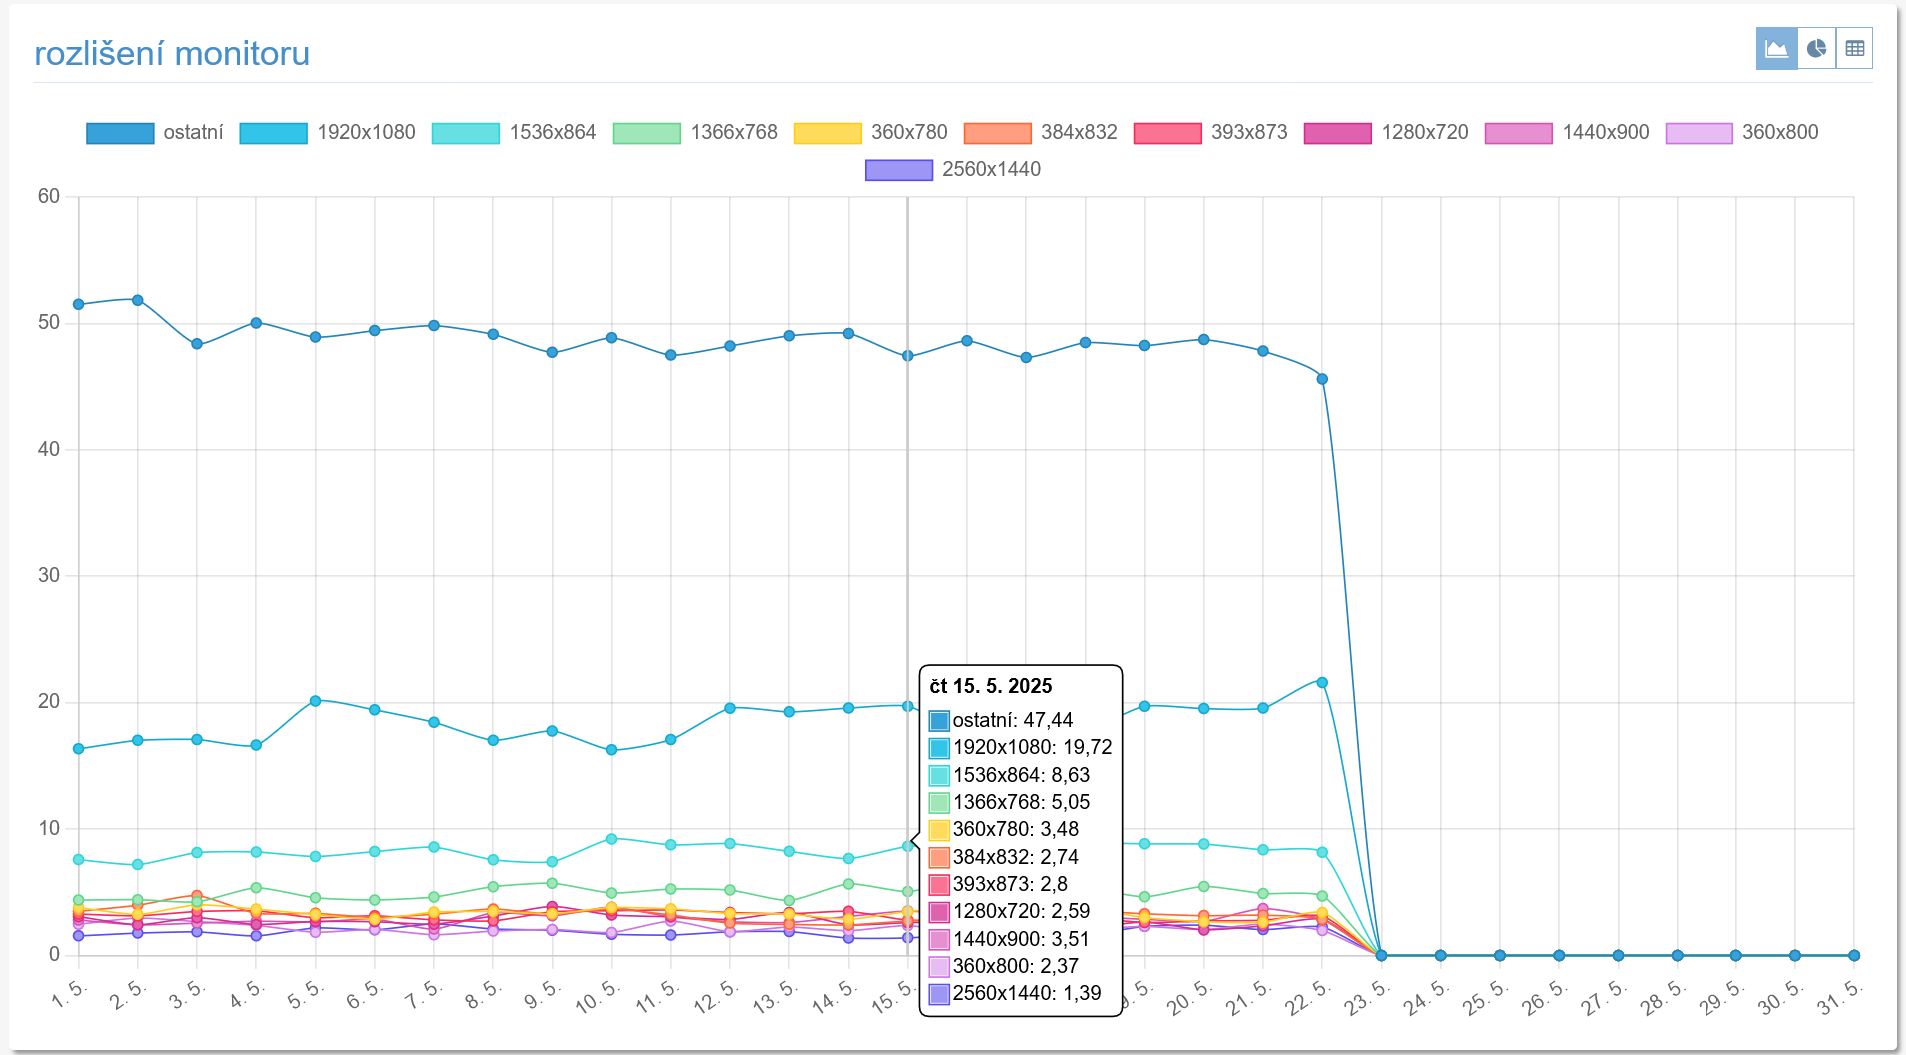
Screen resolution
Sources
The next section shows statistics related to the sources your visitors come from.
All
Table of all referrers linking to your pages.
Domains
Table of referrers linking to your pages, grouped by second-level domain.
Search engines
Graph of the number of visits from search engines over time.
Content
Section with statistics related to the content of your pages.
Entry pages
Table of entry pages, i.e. pages that were the first visited within a visit.
Pages
Table of all viewed pages.
Exit pages
Table of exit pages, i.e. pages that were the last visited within a visit.
Local search
If you set a keyword in your web's settings in the Profi service that means the search parameter on your website (e.g. if the address of your server's search results looks like www.server.com/?search=news, the keyword is "search"), search statistics will be displayed here.
Campaigns
Sources
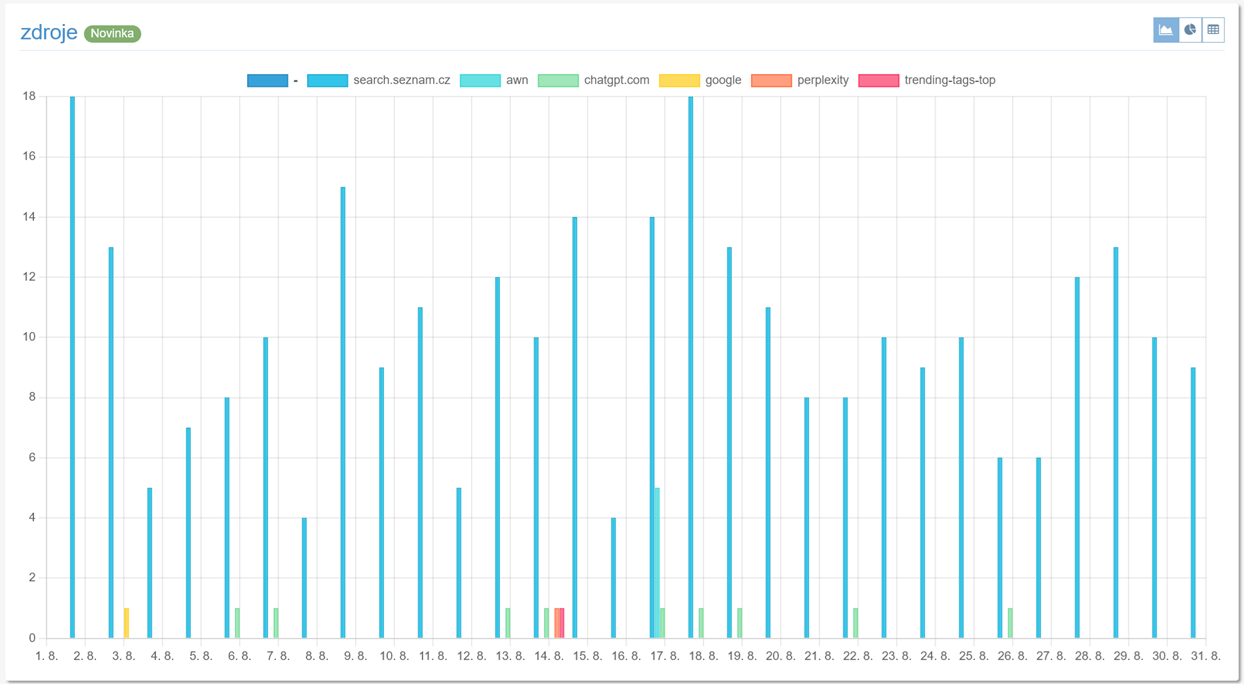 Chart of sources according to the
utm_source parameter
Campaigns
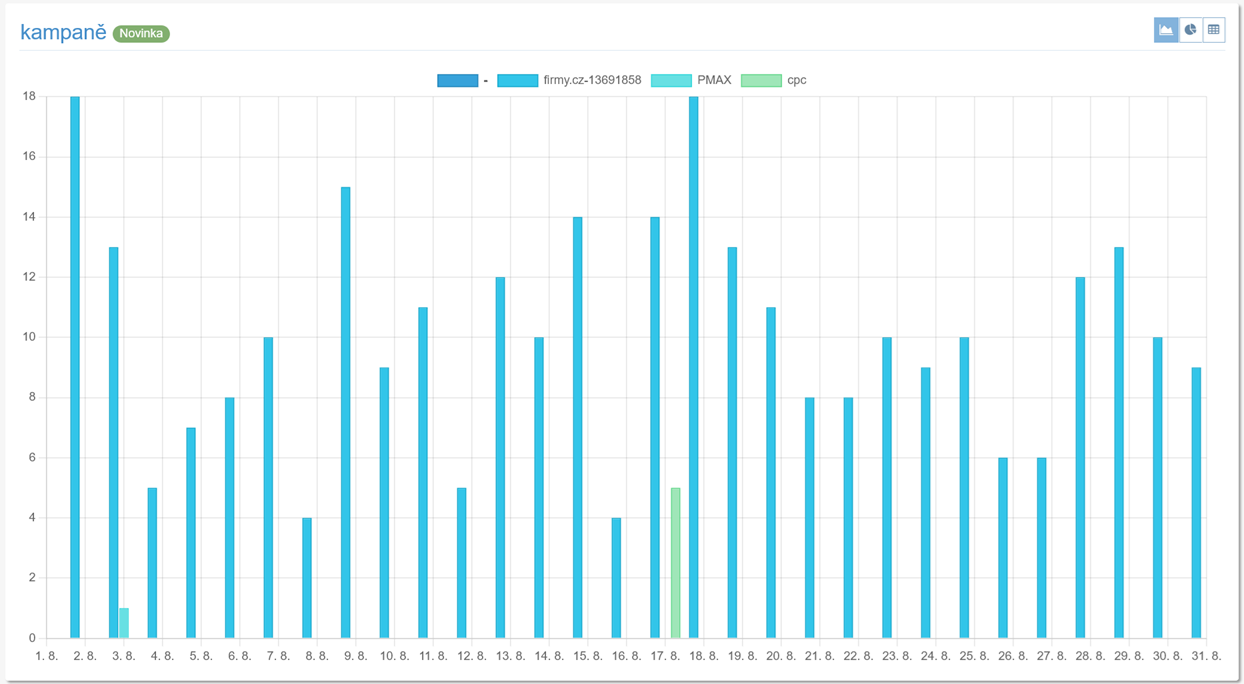 Chart of campaigns according to the
utm_campaign parameter
Profi reports
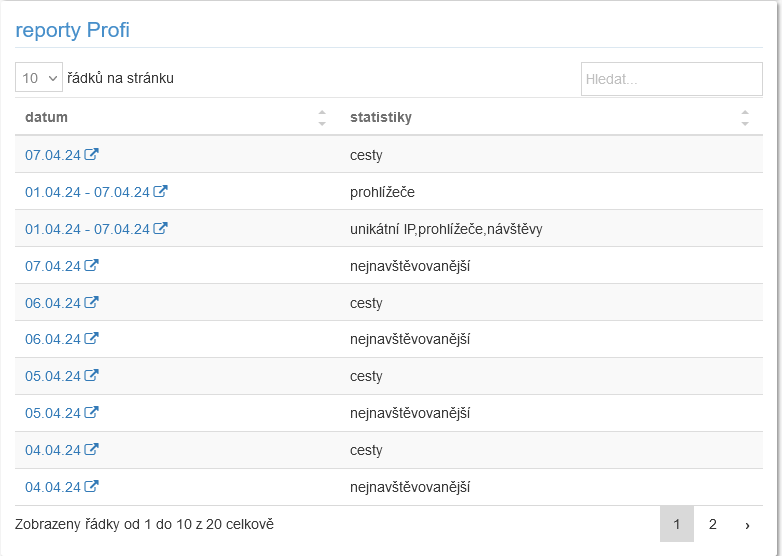 The latest reports generated by the Profi service.